Chapter 1
Introduction
This is as guideline of how users should input the data after walking a route. Users are expected to enter all the data points except Walkability Score and Time every 250 meters of their route.Walkability Score and Time should be entered after ending their route.
Chapter 2
Training Parameter
2.1 Obstacles
2.1.1 Permanent Obstacles
This is a count based metric. Obstacles that will or may not be removed within a considerable period of time, say 3 years. Such obstacles include:
- Lamp posts
- Trees
- Misplaced buildings
- Trash heaps
- Tongs
Data collectors can add other such items which are not included in the list. Collectors will need to note down these obstacles after finishing their routes.
2.2 Temporary Obstacles
This is a count based metric. Obstacles that will be removed after some time or are periodic. Such obstacles include:
- Hawkers
- Construction materials and sites
- Mobile toilets
Data collectors can add other such items which are not included in the list. Collectors will need to note down these obstacles after finishing their routes.
2.3 Hazard
This is a count based metric. Things or materials that can cause bodily harm. Such things include:
- Open manholes
- Fallen trees
- Live electric wires
- Vehicles that travel on the footpath
Data collectors can add other such items which are not included in the list.Collectors will need to note down these obstacles after finishing their routes.
2.4 Cleanliness
This metric is a perception based rating. The ratings are:
- Dirtiest
- Dirty
- Passable
- Clean
- Cleanest
Users need to rate the roads they’ve walked on based on the following samples. Note: these are rough samples, but collectors should rate the roads that resembles the closest to them.
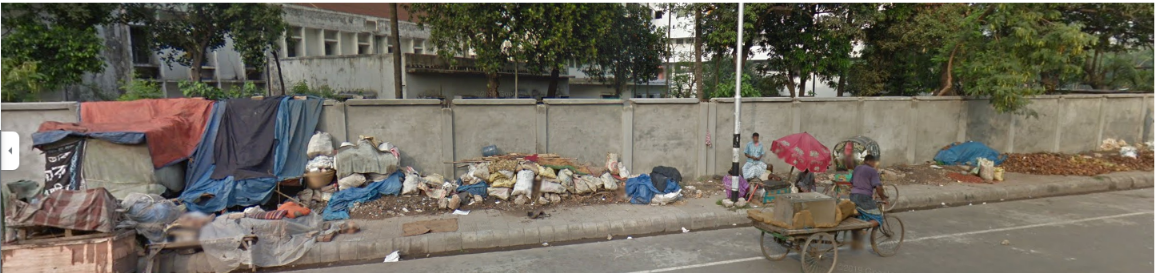
Fig: 2.1 Cleanliness 1
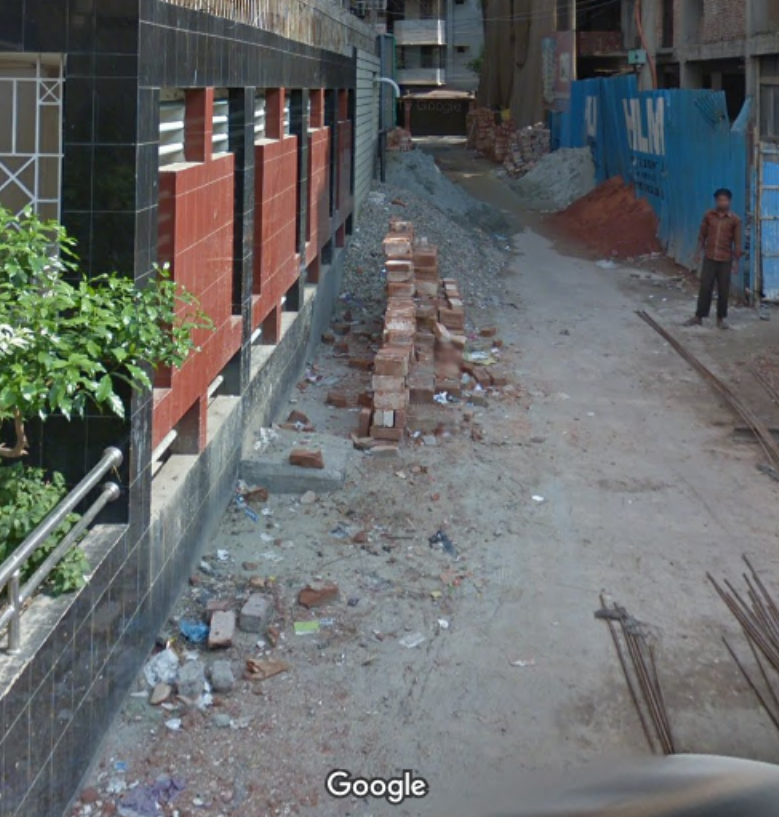
Fig: 2.2 Cleanliness 2

Fig: 2.3 Cleanliness 3

Fig: 2.4 Cleanliness 4
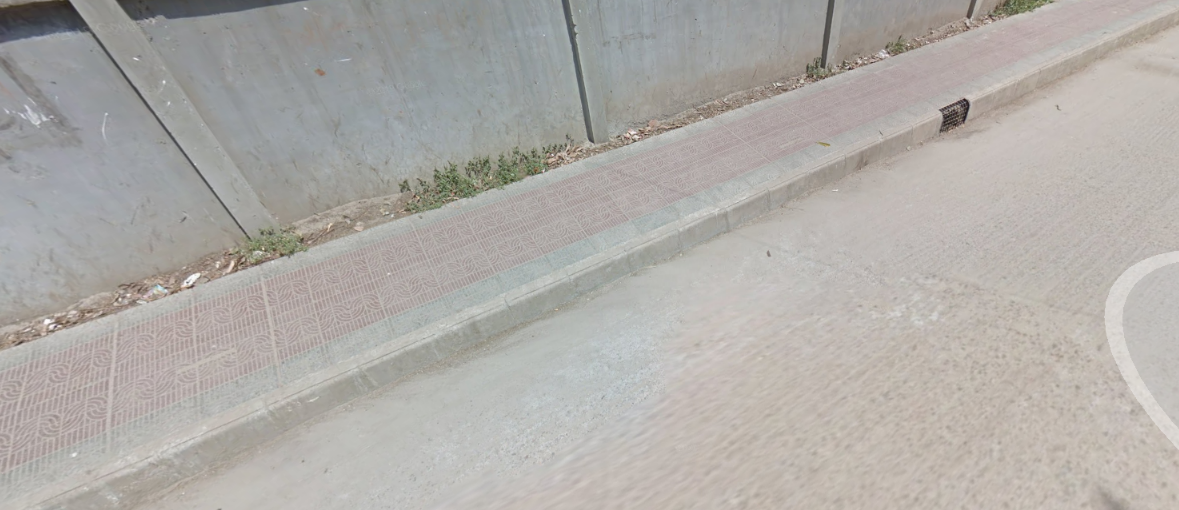
Fig: 2.5 Cleanliness 5
2.5 Safety (Sense of Security)
This metric is a perception based rating. Users need to note down their relative perceptions of how safe they feel while walking on a certain road. This may be affected by their age, their gender, the time when they are walking and other aspects that concern the user themselves.
3 levels have been defined for the cause:
- The user felt no danger whatsoever
- The user was not harmed in any way, but felt a sense of danger
- The user had anecdotal experience of feeling very unsafe while walking
2.6 Congestion
This metric is a perception based rating. The ratings are:
- No congestion
- Low congestion
- Passable
- High congestion but walkable at a regular pace
- Too congested to walk. Slows you down.
Users need to rate the roads they’ve walked on based on the following samples. Note: these are rough samples, but collectors should rate the roads that resembles the closest to them.
Fig: 2.6 Congestion 1
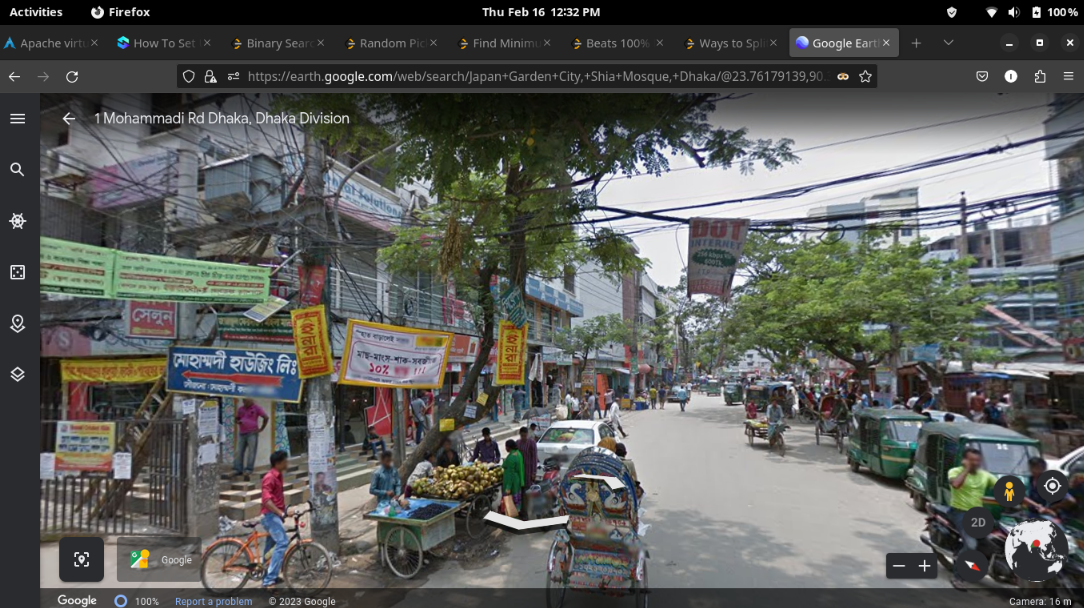
Fig: 2.7 Congestion 2
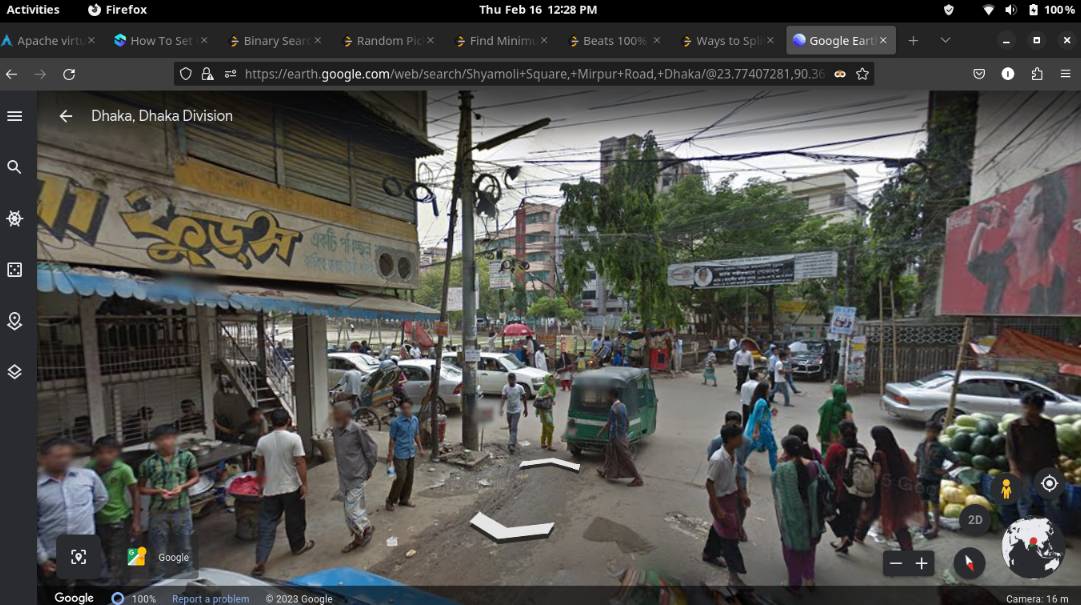
Fig: 2.8 Congestion 3
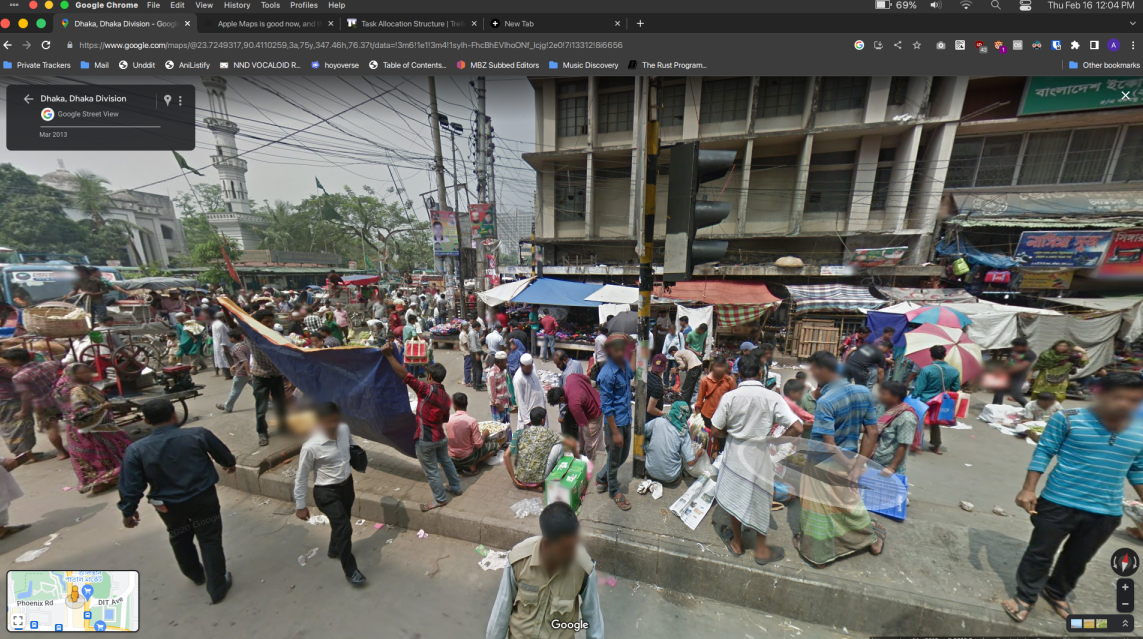
Fig: 2.9 Congestion 4
Fig: 2.10 Congestion 5
2.7 Road Width
This metric is a perception based rating. Users need to estimate how many people can walk side-by-side. This rating will be between 1 - 3.
2.8 Walkability Score
This is an inferred score of the route that the collector has walked on. This rating will be between 1 - 5. This will depend on all of the input parameters mentioned.
2.9 Target Parameters
2.9.1 Time
Users need to start a stopwatch from the beginning of their route till the end to calculate the total time taken.
2.10 Apps/tools required
- Gaia GPS
- Stopwatch
- Water
2.11 Data Entry Format
Copy the following text when entering data:
- Permanent Obstacles:
- Temporary Obstacles:
- Hazards:
- Cleanliness: /5
- Safety: /3
- Congestion: /5
- Road Width : /3
- Walkability Score: /5
- Time: sec